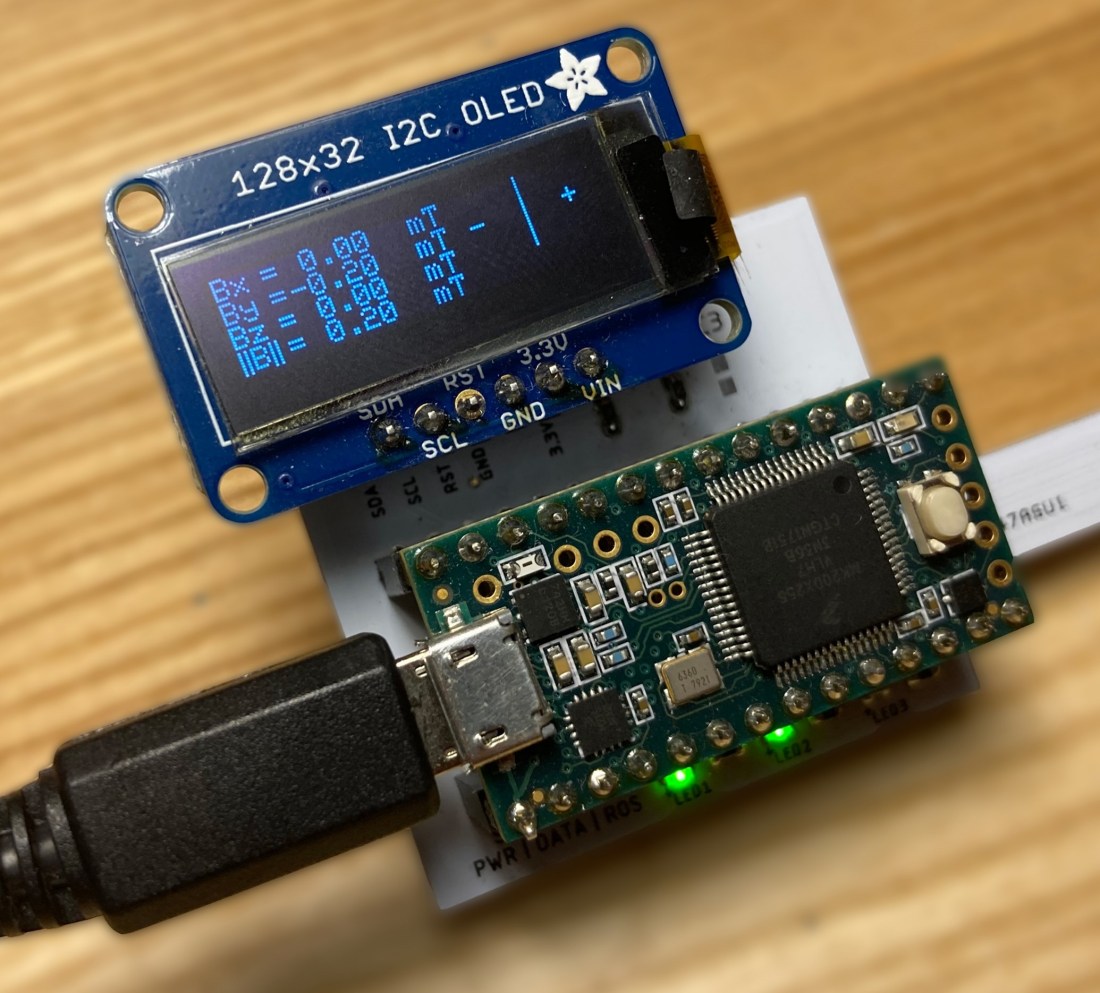
I do a lot of work with magnets at the Utah Telerobotics Lab. Often, I need to take measurements of a local magnetic field, so I use a magnetometer. My lab has a few magentometers, some of which are very accurate and have a small maximum field magnitude reading, and some are less accurate but can measure larger fields. One of these less accurate but more versatile magnetometers is a custom device built by Dominick Ropella at Vanderbilt University. It consists of a Teensy 2.0 microcontroller which is attached to a custom PCB that contains an Infineon TLV439D 3D magnetic sensor. When we received the sensor from Dominick, it used ROS to display and record sensor data. I believe this is because Dominick used this sensor as a pet-project to learn to use ROS, and while that’s fine and good, ROS is fairly cumbersome and has quite a steep learning curve that is unnecessary to contend with if all you want to is do record and visualize data from a sensor. As such, the sensor went unused for a few years because it was simply too annoying to set up to actually get used.
I wanted to make the sensor more versatile and I wanted to become more familiar with Python, so I wrote a Python-based program to visualize and record data from the sensor. At a high level, the Teensy sends data to the user’s computer over serial, and the Python program plots the data in real time while offering the ability to record the data as a .csv file. The program automatically detects if a user is running the program on a Windows, Linux or WSL operating system and changes the procedure for reading the serial port accordingly. To round the project out, I created documentation for the sensor and published it as a public repository on my personal Github.
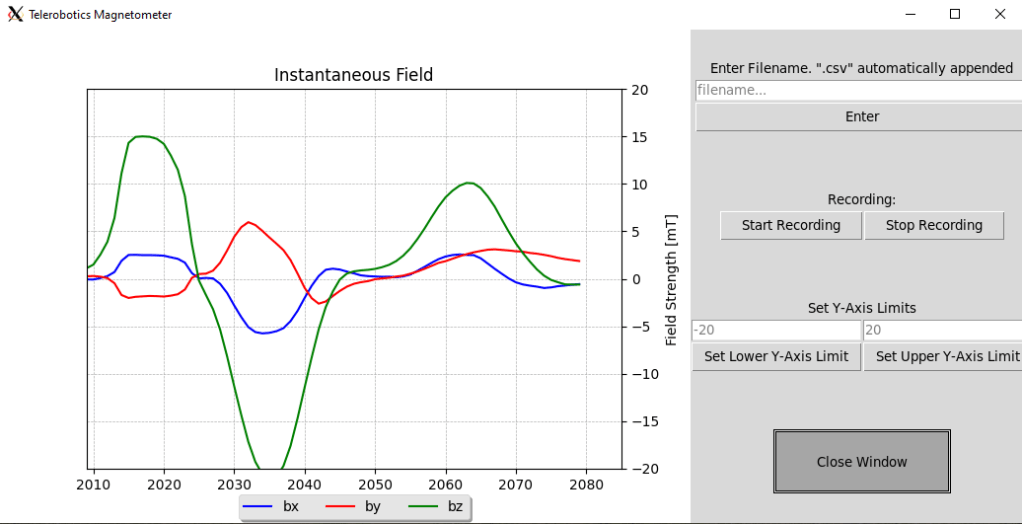
Specifically, I use the Pyserial module to serial-read the incoming data, then I plot the data on a matplotlib animation within a Tkinter GUI. From the GUI one can specify a filename, record data to a .csv file with that filename, and change the axis limits of the real-time animation.
