In my senior year as a mechanical engineering student at the University of Utah I was part of a 6 person team that was assembled to solve a problem for our year-long Senior Design Capstone class. As a team we chose to submit a design to the 2021 IEEE ITherm student heat sink design competition. The international competition called on student teams to design, build, and validate an aluminum heat sink made with additive manufacturing. First, students design a heat sink and submit the design along with a formal whitepaper explaining the engineering principles used in formulating the design, and the engineering tools used to evaluate the design. The submissions are graded according to their professionalism, their use of good engineering, and the performance of the heat sink designs in a computational fluid dynamics (CFD) simulation. The top five teams in this round move on to have their designs additively manufactured (metal 3D printed) by GE Additive. These designs were then tested in a purpose-built testing environment at Oregon State University. After receiving the results, student teams present their designs at the ITherm conference and the teams are judged by the quality of their presentation, the quality of their engineering, and the results of the heat sink testing.
Our team, consisting of Carter Cocke, Bence Csontos, Erik Steenburgh, Michael Alverson, Hunter Scott, and myself, spent two semesters on this project meeting several times a week to ensure that our submission was not only the the absolute best it that could be, but that it was a reflection of our collective engineering prowess.

The ITherm 2021 competition grading is heavily reliant on a figure of merit (FOM) equation that is inversely proportional to the price of the heat sink (i.e., heat sink volume) and the difference between the base heat sink and ambient air temperatures. Given this, our heat sink needed to reject the most amount of heat possible with the least amount of material. A basic rectangular fin heat sink and pin fin heat sink were analyzed using computational fluid dynamics (CFD) in both Ansys and COMSOL to verify that the base heat sink temperature was similar to known heat transfer correlation. The Ansys multiphysics simulation was shown to achieve results that more accurately matched the heat transfer correlations when compared to the COMSOL multiphysics simulation. We utilized an iterative approach to come up with a final heat sink design that maximized the FOM. For each heat sink iteration, a full steady-state thermal CFD simulation was performed, analyzed, and used to update the design. From the final Ansys Fluent model, the average base temperature of the heat sink and FOM came out to 429.8 K and 0.002268 $-1⋅K-1, respectively. With this FOM value, our use of additive manufacturing, and our white paper report, our team advanced to the semifinals of the competition. Our heat sink design was then updated to reduce the risk of failure during production through the addition of truss supports and filets. Our design has since been successfully additively manufactured by GE was physically tested and compared to other semifinalists. Our heat sink performed the best out of all of the design submissions, by a wide margin.
The official release of the news from the University of Utah Department of Mechanical Engineering can be found here.
Below is the poster we presented for our senior design class. It can also be found here.
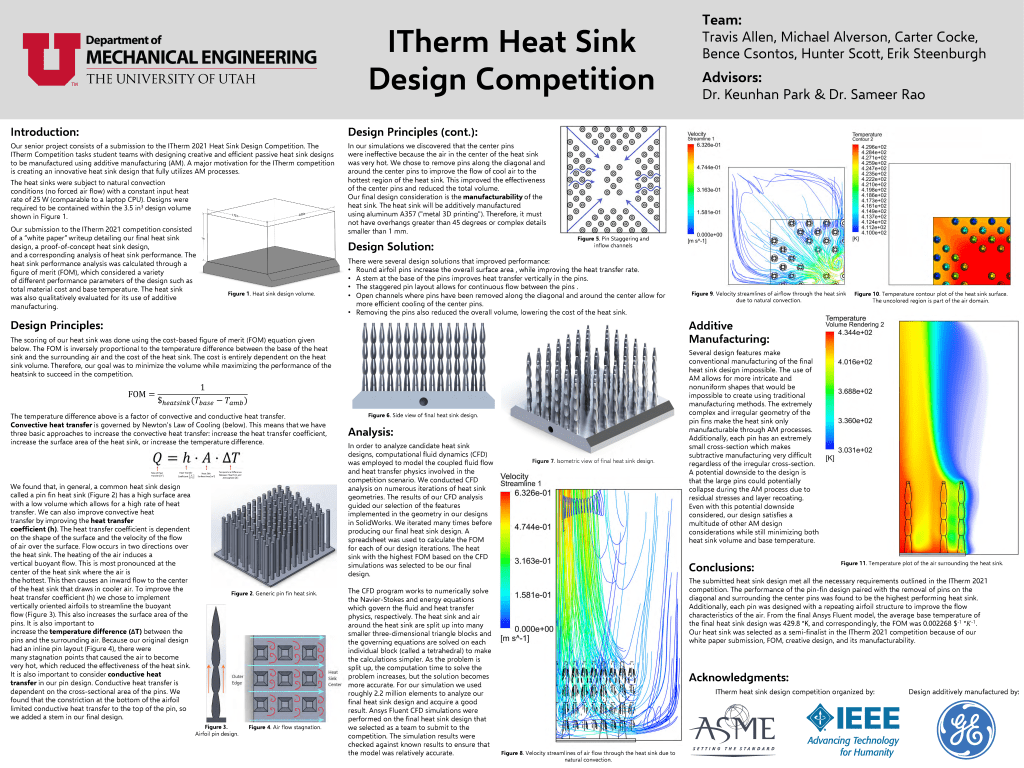
Below is a lengthy description of the engineering intuition and process that our team used to compete in the ITherm 2021 Student Heat Sink Design Competition.
The primary requirement of any heat sink is to dissipate heat in an efficient manner given the method of heat transfer it is meant to address. Additional, more nuanced, requirements must also be considered to create a high-performing heat sink. The amount of material used when manufacturing the heat sink must be addressed especially when the heat sink design is going to be produced in large quantities. Manufacturability is also a requirement that must be addressed. Given that our heat sink was designed for additive manufacturing, we were not limited by the traditional constraints of heat sink creation. The project-specific requirements for our design narrowed down the scope of our problem. We had to create a heat sink capable of efficiently dissipating heat in a natural convection situation while using as little material as possible and guaranteeing that the final design would be manufacturable using aluminum 3D printing.
We spent a great deal of time between September 2020 and February 2021 learning how to use the topology optimization program PLATO. PLATO is a topology optimization software currently under development by Sandia National Laboratory that attempts to optimize the topology of a specific design domain such that some design parameter(s) are minimized. Our team met with Dr. Miguel Aguilo, a developer of PLATO, several times to try to adapt PLATO to our specific use case. Unfortunately, the PLATO CFD implementation is still actively being actively developed and was not completed soon enough for us to use PLATO for our project.
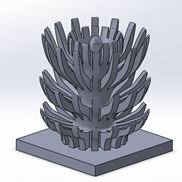
Once we decided that we could not use PLATO for the competition, we began to look at the results of previous topologically optimized heat sinks from the research literature. While reviewing these, we noticed that many had shapes that we thought resembled coral polyps. We did a literature search and found a paper that categorized coral growth morphology according to the Peclet number of the flow of water that the coral grew in. Using this, we designed coral-like structures that mimicked the low-Peclet number coral growth shape. These designs suffered from high conduction resistance at the base and an inability to be additively manufactured due to overhang constraints, so we decided to take a different approach and look at pin fin heat sink designs.
Our heat sink will be scored with a cost-based figure of merit, shown below. The figure of merit depends on the cost of the heat sink, which is equal to the product of the volume of the heat sink and the volumetric cost of the aluminum A357 that it will be manufactured from, and the temperature difference between the base of the heat sink and the atmosphere. This structure penalizes heat sinks that use a lot of material and heat sinks that are not very effective. As such, our goal was to minimize the heat sink volume and maximize heat transfer from the heat sink to the atmosphere.

where 𝑉_𝐴𝑙 is the heat sink volume, 𝜌_𝐴𝑙=2670 kg/m3 and 𝐶_𝐴𝑙=60 $/kg are the density and cost of A357 aluminum, respectively, 𝑇_𝑇𝐶 is the base thermocouple temperature, and 𝑇_𝑎𝑚𝑏=303.15 K is the ambient air temperature. The thermocouple temperature was assumed to be the same as the volume-averaged base temperature of the heat sink.
The heat sink has two modes of heat transfer that are important for us to consider: conduction and convection. Note that radiation, while not entirely negligible, is not something we have control over due to the material and surface properties of the final product being out of our control, so we have not considered it. Convection is governed by Newton’s law of cooling, which is given in below.

Considering this, we want to maximize 𝑄, the rate of heat transfer from the heat sink to the atmosphere, and we can accomplish this in three ways. First, we can increase the heat transfer coefficient, ℎ. The heat transfer coefficient is dependent on the shape of the surface and the velocity of the flow of air over the surface. The shape of the surface primarily affects the thickness of the thermal and velocity boundary layers of the flow. Some surfaces, like airfoils, are designed to minimize the thickness of these boundary layers. In general, as the thickness of the thermal and velocity boundary layers decrease, the heat transfer coefficient increases. Flow occurs in two directions over the heat sink: a vertical flow and an “inward” or transverse flow. The heating of the atmospheric air causes a buoyant flow in the vertical direction, which is most pronounced at the center of the heat sink where the air is hottest. This, in turn, causes an inward flow that draws cold air into the center of the heat sink. In general, a faster flow of fluid over the heat sink will result in a higher heat transfer coefficient. For our design, we experimented with different NACA airfoil geometries to reduce the thickness of the boundary layers and maximize the heat transfer coefficient.
The next item to consider when trying to maximize convective heat transfer is the surface area. Due to the relationship in Newton’s law of cooling, as the surface area of the heat sink increases, so too does the heat transfer rate. With this in mind, we examined shapes with a high surface area-to-volume ratio to use in our heat sink.
Finally, we looked at maximizing the temperature difference between the heat sink and the atmosphere. While this may sound obvious or non-remarkable because this is the goal of this project, with some nuance and careful consideration we can see why this is important to pay attention to. At each point on the heat sink, there is a temperature difference between the air that surrounds the heat sink and the heat sink itself. At the edges of the heat sink, farthest from the center, this temperature difference will be the largest, while at the center and the base of the heat sink, this temperature difference will be the smallest. A small temperature difference amounts to a smaller heat transfer rate, which is undesirable. Thus, if we can maximize the temperature difference at each point on the heat sink, we can maximize the heat transfer rate at each point on the heat sink, which increases the overall heat transfer rate. This is accomplished by having more opportunities for cool air to be drawn into the hottest parts of the heat sink with minimal resistance. In our design, we staggered the pin layout so that there was minimal airflow stagnation as cool air radially entered the heat sink. We also removed pins along the main diagonals, which were the areas with the longest distance from the edge of the heat sink to the center.
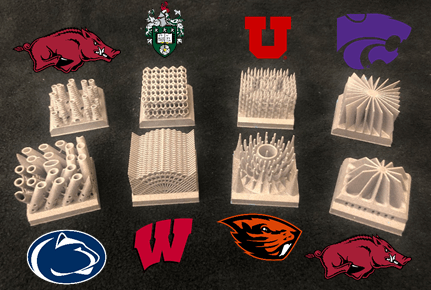
With these design principles in mind, we performed a pseudo-parametric CFD study where we kept track of the performance of more than 30 heat sink designs that had some combination of the above features. We calculated the figure of merit for each of these designs and recorded each in a spreadsheet that served as our selection matrix. For clarity, the best results from this table are shown in Table 2. The designs with the most significant design alterations are shown in the grid below. We selected the heat sink with the highest figure of merit as our design submission to the competition.

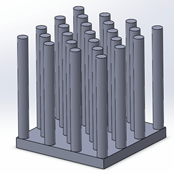
Final Design:
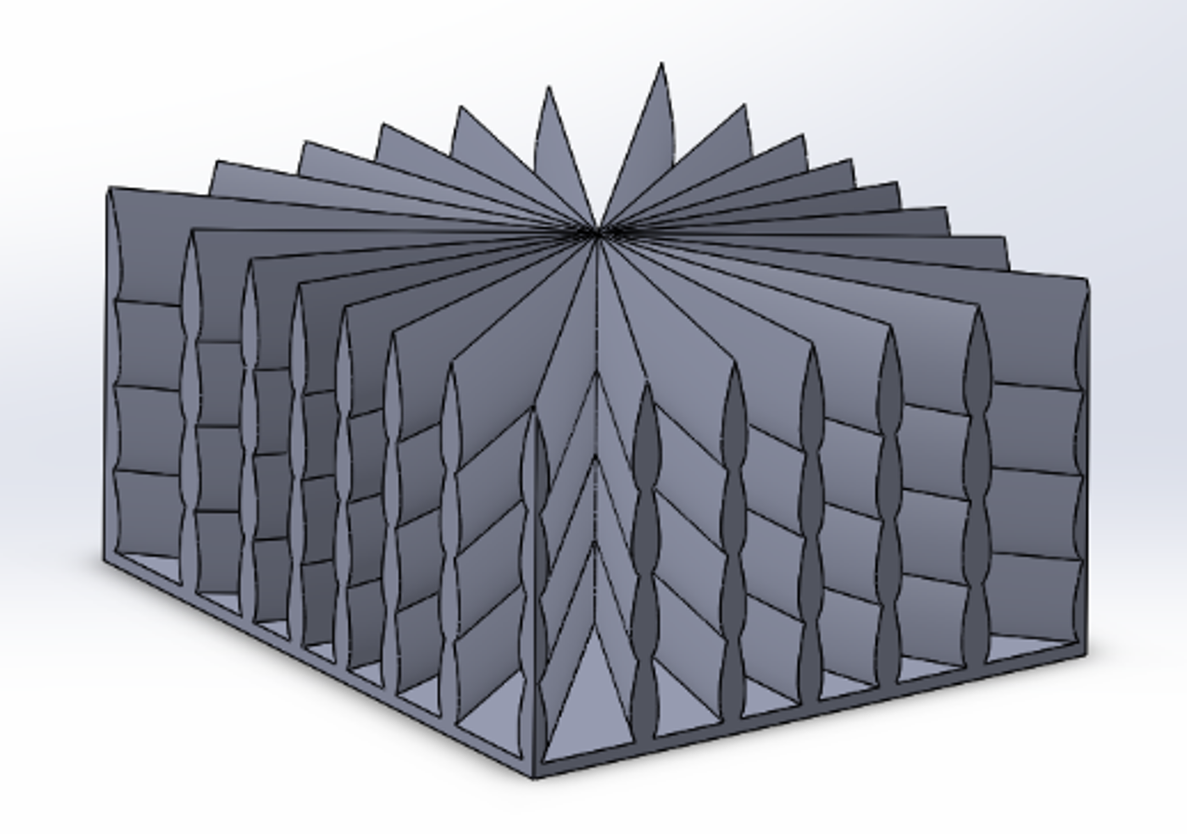
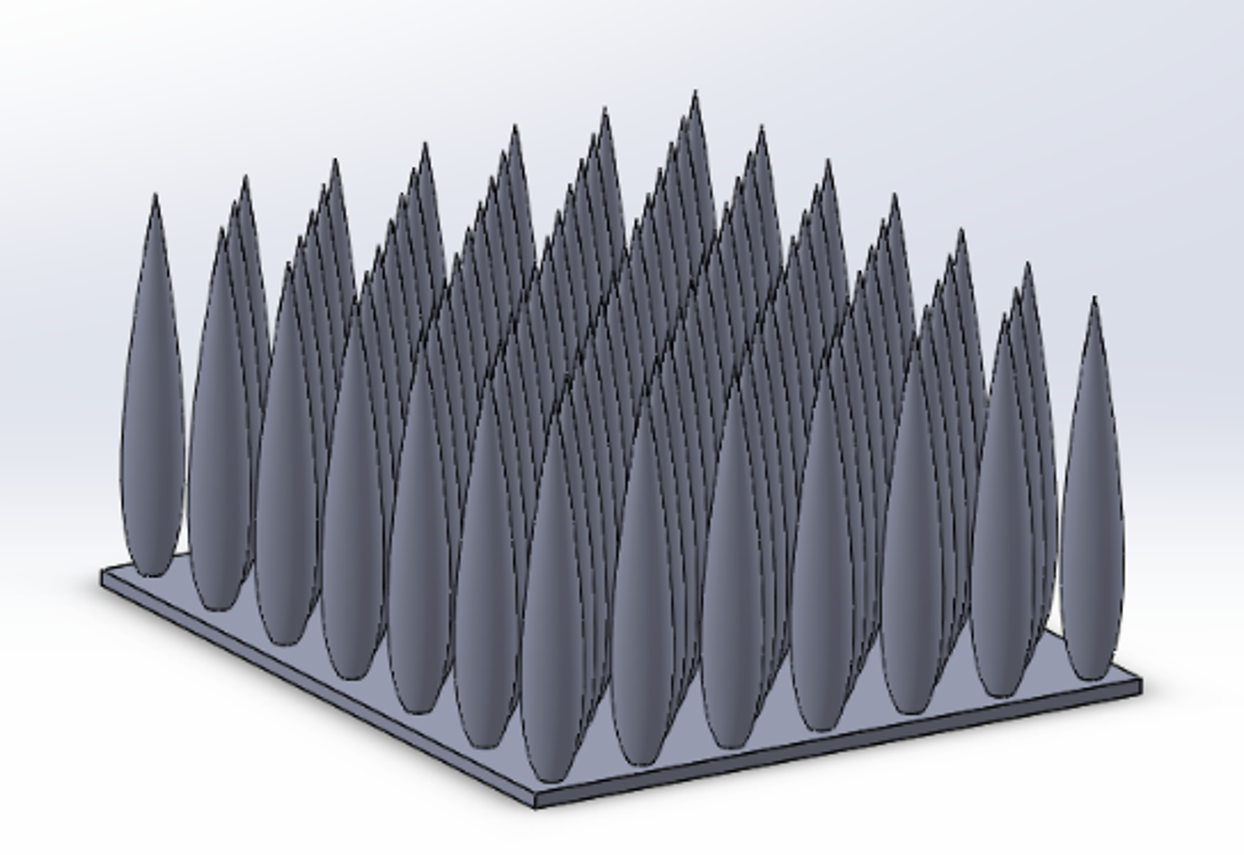
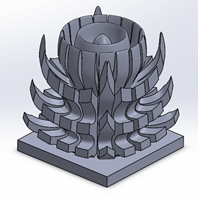
Our final heat sink design submission to the ITherm heat sink design competition is shown below in Figure 1. Each pin consists of an axisymmetric cross-section of four stacked airfoils that is revolved around an extruded cylinder. The airfoil shape of each pin was designed using a symmetrical NACA-0024 airfoil [1] modeled using the equation below.

The airfoils were added to a small cylinder with a diameter of 0.14 mm to aid in design, resulting in a total thickness of 2.14 mm. This specific airfoil shape was chosen to reduce the boundary layer thickness, thus maximizing the heat transfer from the wall to the air. Additionally, several airfoils were stacked on top of each other to increase the surface area by 17.3% compared to a similar cylindrical pin with a diameter of 1.7 mm.
Each pin diameter is 2.14 mm at the thickest point, and 1.26 mm at the thinnest point. At the bottom of the pins, we added a tapered cylinder with a maximum diameter of 2.5 mm to improve conduction from the heat sink base to the fins. A small cylinder with a diameter of 1 mm was added at the top of the fins to remove the sharp tip of each airfoil, increase surface area, improve manufacturability, and improve simulation convergence.
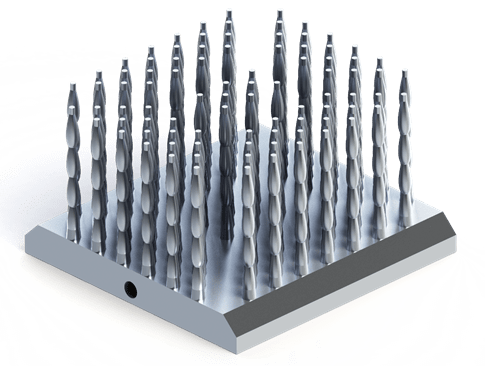
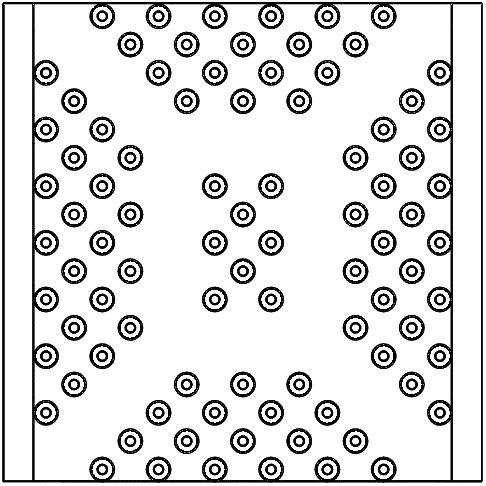
Another key feature added to the design was a staggered pin layout to promote airflow toward the center of the heat sink. The goal of this design feature was to limit air stagnation between fins, improving heat transfer in those areas. This staggered design is shown below. Additionally, the pins along the diagonal and surrounding the center were removed to promote airflow to the center pins. This adds air inlet channels that funnel cool ambient air towards the center of the heat sink, improving the center pin effectiveness while decreasing the heat sink volume, thus improving the FOM. The final fin array is comprised of 88 pins with a maximum spacing of 3.5 mm and a minimum spacing of 2.12 mm in the concentrated region of the array.
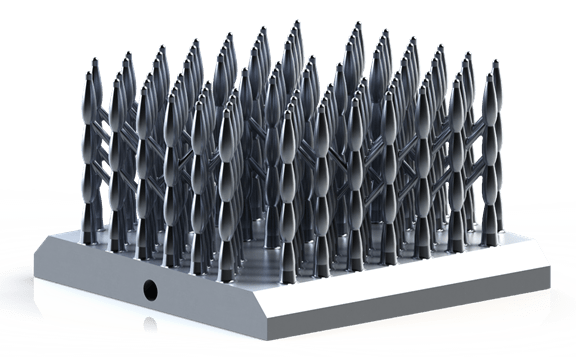
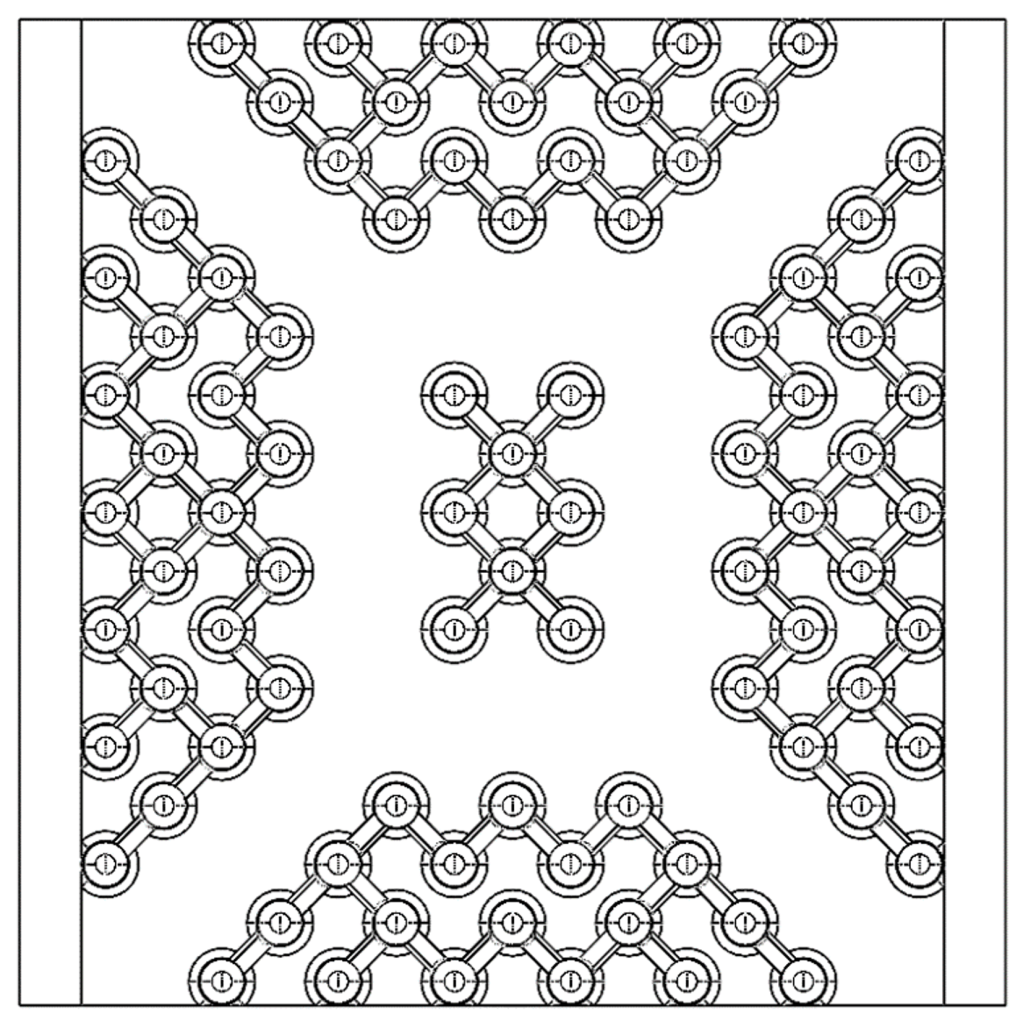
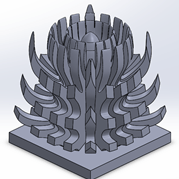
After our selection as semifinalists in the ITherm heat sink design competition, we received design feedback from GE to reduce the likelihood of failure during manufacturing. Based on this advice, we added fillets to all sharp edges that reduce the possibility of stress concentrations. We were also concerned that the pins could fracture during the manufacturing process due to the change in diameter caused by the stacked airfoils. The force from the recoater motion could cause the pins to fracture at any of the constrictions. Because of this we added cylindrical truss supports between the second and third levels of the pins, connecting the minimum pins possible to reduce the volume increase. The final volume increase due to the addition of the supports was only 1%. We connected the second and third levels to avoid reducing the inward flow on the bottom level. Our updated final design is shown below, with a top-down view of the truss layout below that.
Performance Verification:
CFD Modeling: Testing and Results
Given that the heat sink designs are extremely complex, CFD is required to model the coupled heat transfer and fluid flow physics to calculate the heat sink temperature and FOM for each design. While it is technically possible to model all the underlying physics (heat transfer, convection, radiation, contact resistance, etc.), there are hardware, software, and runtime limits that require model assumptions and simplification. For verification purposes, we attempted to use both ANSYS and COMSOL to analyze the rectangular fin heat sink for comparison to the mathematical model but were only able to get results that matched the heat transfer correlations with ANSYS Fluent.
Ansys Fluent Modeling of Rectangular Fin Heat Sink
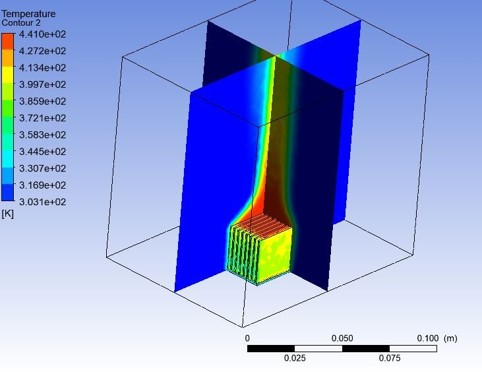
To model the rectangular fin heat sink in Ansys Fluent, heat transfer and laminar flow were coupled through the Navier-Stokes and energy equations. Gravity was enabled to model the buoyant forces driving natural convection, and flow was assumed to be incompressible. The Boussinesq approximation was used to speed up computational time. The Boussinesq approximation assumes all fluid properties are constant except density variation in the buoyancy term in the Navier-Stokes equation. The fin heat sink was modeled first in SolidWorks and then loaded into Ansys. An air box with dimensions of 0.12 x 0.10 x 0.13 m was added around the heat sink. The defining boundary conditions used in the model were a heat flux of 11071 W/m2 added at the base of the heat sink, a velocity inlet at the bottom of the bounding box of 0 m/s, a pressure outlet of 0 Pa (gauge pressure) that allows for backflow, and constant temperature conditions of 303.15 K (ambient temperature) along all sidewalls of the bounding box of air.
The model used the automated meshing in Ansys Fluent because it meshed much faster than using custom mesh settings. The mesh size used to run the converged result was 0.002 m to capture the fluid behavior along the surface of the fins and in between the fins.
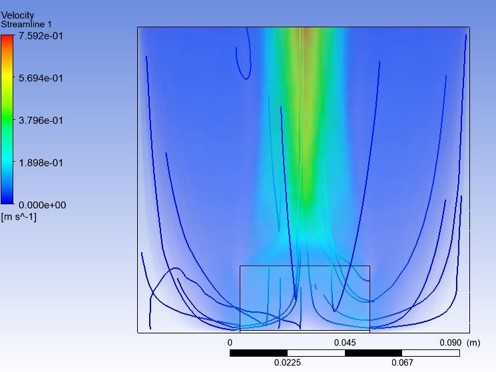
After meshing, the model was run using a pseudo time stepping method to calculate a pseudo steady state solution. The base temperature that was calculated using this method was 441 K. This was compared with the verification model which yielded a base temperature of 387 K. There is only a 15% relative error compared with the verification model which can be attributed to the assumptions made in the model. The figures below give a visual representation of the temperature and velocity gradients, respectively. The figures below match the expected behavior of natural convection heat transfer from a heated surface.
Simple Convection Modeling
We applied a simple convection thermal model to our original midterm prototype design that assumed a constant value for the heat transfer coefficient, h, across the entire heat sink. This model was verified using the same rectangular fin heat sink as the mathematical model as in Appendix A. While the heat transfer coefficient does not apply accurately to this design, the simplified model will determine if the prototype is an effective improvement in fin conduction over the simple rectangular heat sink design. The results in the figure below show that the average base temperature was 550 K, which is much larger than the base temperature of the rectangular fin heat sink. We determined that this discrepancy could be caused by a much lower cross-sectional area at the base of the heat sink which limited conduction.
Based on the results from the initial design phase above, we added more connections to the bottom plate to aid with conduction and performed the same thermal analysis as shown below. The average base temperature improved to 523.5 K, however, this is still much higher than the rectangular fin heat sink, so we determined that more design concept analysis was necessary to build a better heat sink.

Simple Convection Modeling – Design Concept Comparison Testing Methods
Due to the poor results from our initial prototype, we began testing many simplified design concepts to determine how we can improve our design. As in the process above, we chose to use the ANSYS Steady State Thermal solver to evaluate the simplified version of our design concepts. For these simulations, the designs were simplified to fit in a 10 x 10 x 10 mm3 volume with a 1 mm thick base. Once we found a design that performed better than the rectangular plate fin heat sink, we were able to evaluate it comprehensively using CFD.
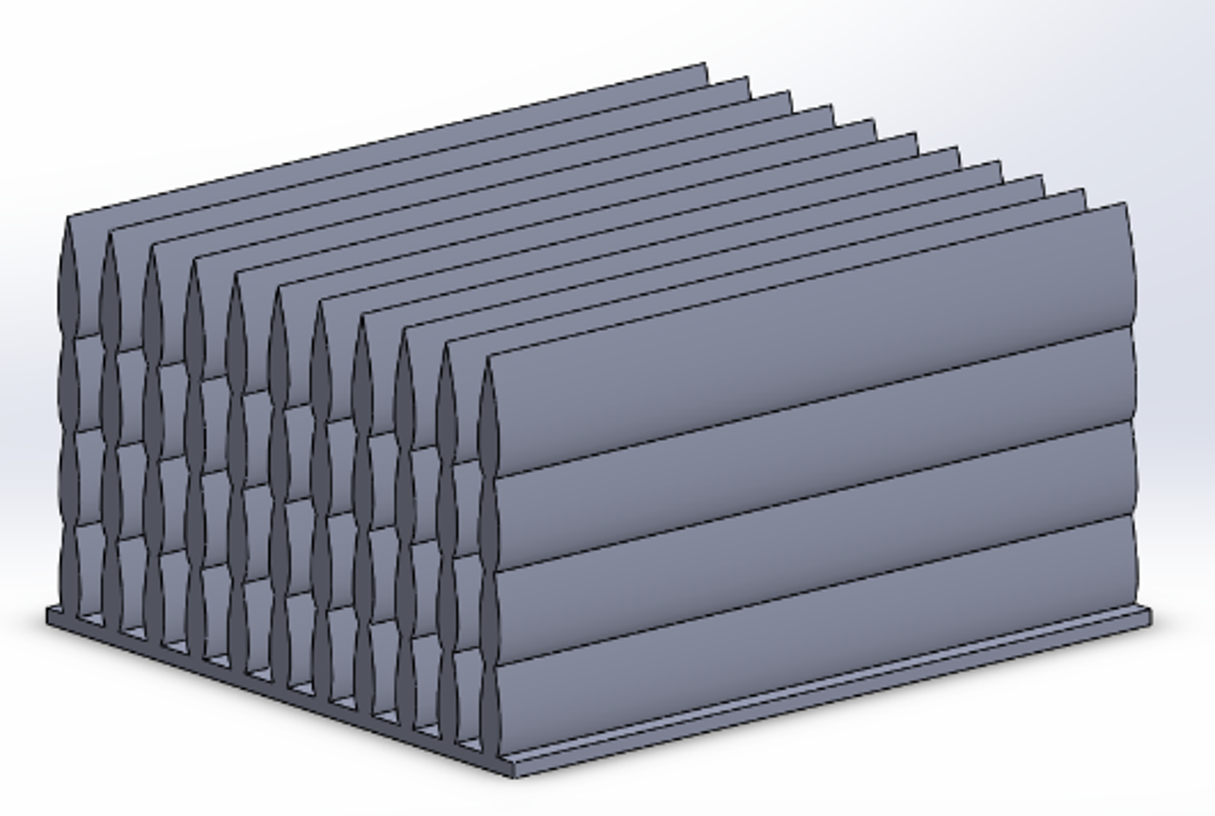
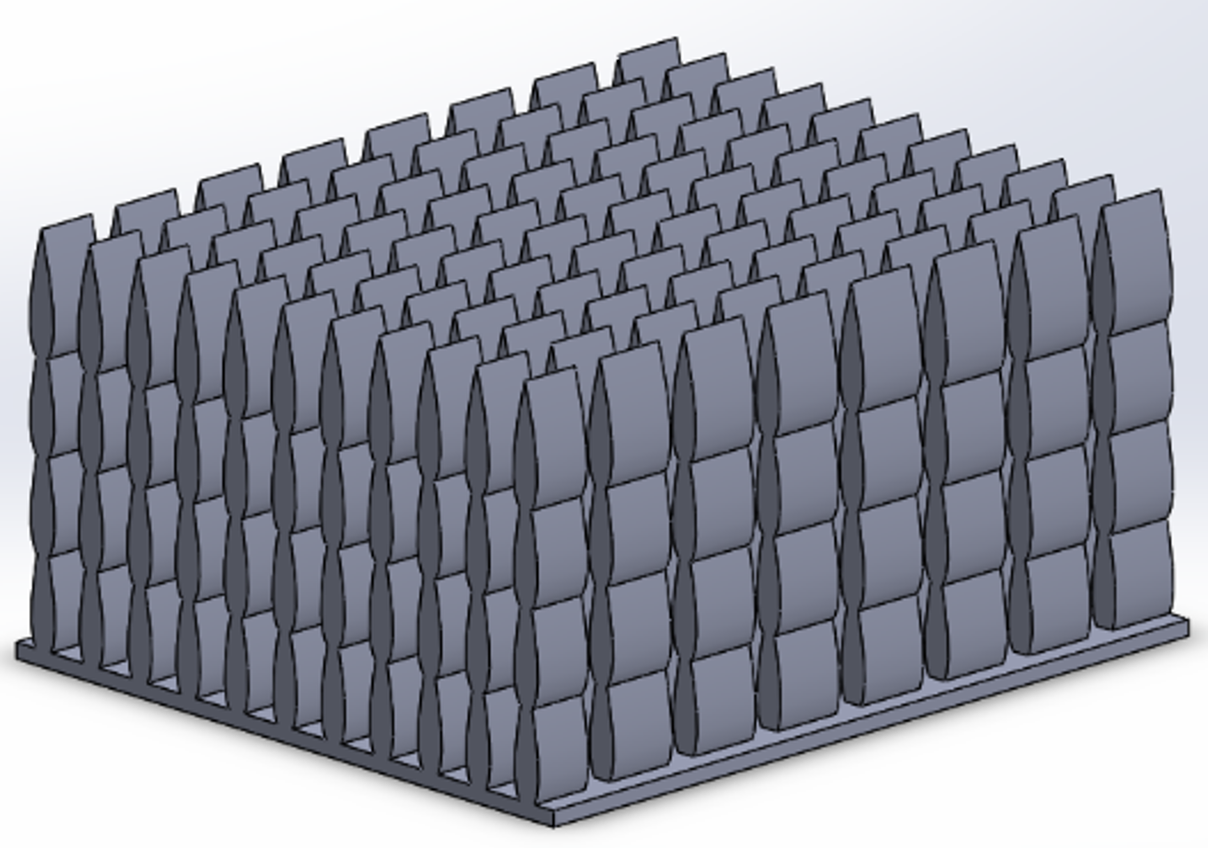
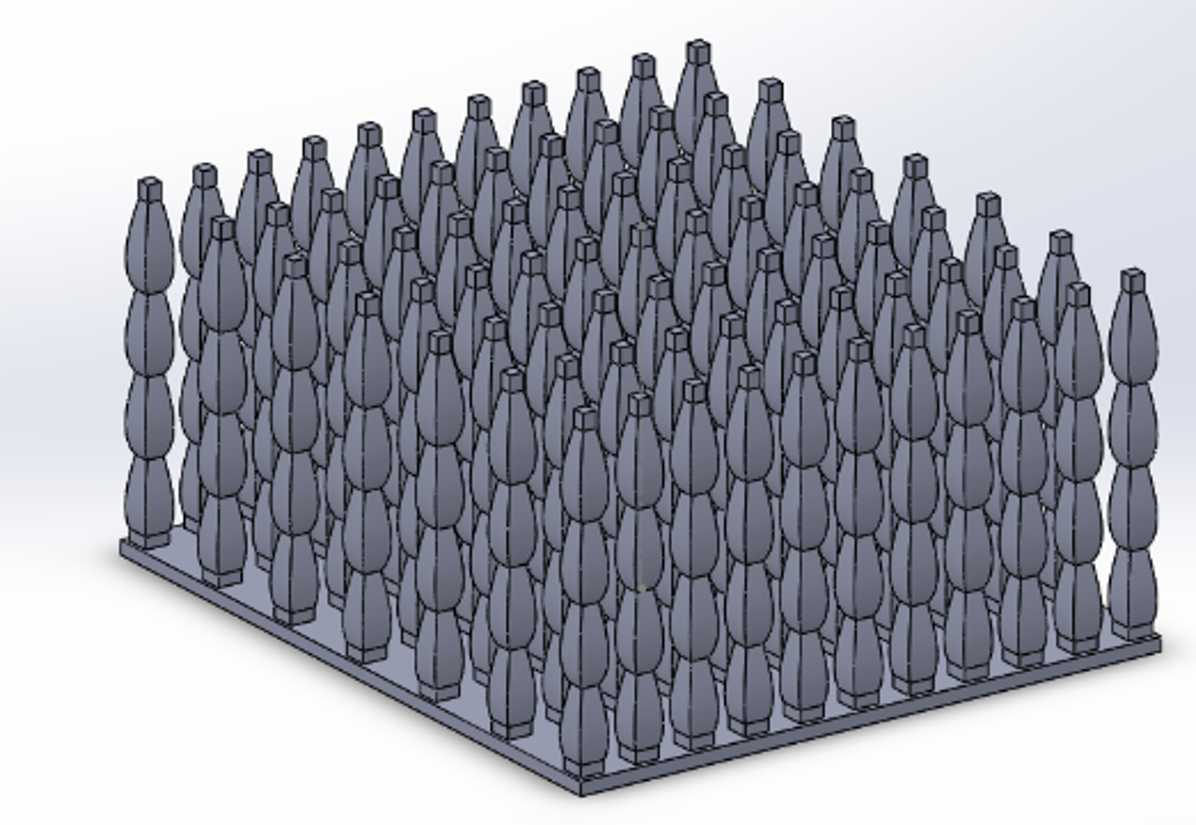
Each Design we evaluated for this test is shown below. We evaluated a simple rectangular fin heat sink and pin fin heat sink for a basis of comparison. We then designed three different coral heat sinks to compare against the original heat sink.

From left to right, top to bottom: 1) Rectangular Fin heat sink for small scale comparison. The fins are 1 mm thick and 10 mm tall with a 2 mm space in between. 2) Pin Fin heat sink for small scale comparison. The fins have a radius of 1 mm and are 2.5 mm apart. 3) First iteration of a coral design that fits within the 10 x 10 x 10 mm3 volume. 4) Second iteration of a coral design that fits within the 10 x 10 x 10 mm3 volume. This was designed with a larger trunk diameter of 7.14 mm to improve conduction to the branches. 5) Third iteration of a coral design that fits within the 10 x 10 x 10 mm3 volume. This design has more cuts to create more branches and surface area to improve convection.


From left to right, top to bottom: 1) Steady State Thermal results for the simplified rectangular fin heat sink. The average base temperature is 446.8 K. 2) Steady State Thermal results for the simplified pin fin heat sink. The average base temperature is 470.3 K. 3) Steady State Thermal results for the first iteration coral heat sink. The average base temperature is 485.5 K. 4) Steady State Thermal results for the second iteration coral heat sink. The average base temperature is 449.7 K. 5) Steady State Thermal results for the third iteration coral heat sink. The average base temperature is 434.5 K.
Final Design Analysis:
Two heat transfer correlations were used to compute the theoretical average heat transfer coefficient and base temperature of a rectangular fin (Tari, et al. [2]) and pin fin heat sink (Churchill and Chu [3]) using the design constraints given in the ITherm 2021 competition. For use as reference points for future designs, the theoretical FOM was calculated using the code given in Appendix A. These heat transfer correlations were also used to verify Ansys Fluent computational fluid dynamics (CFD) simulations on identical heat sink geometries as described above. The Ansys Fluent models were set up using fully coupled heat transfer and laminar fluid flow physics. For all heat sink geometries, an air domain was added around the heat sink to model natural convection heat transfer. A velocity inlet boundary condition with zero velocity was defined at the bottom of the air boundary. A pressure outlet with zero relative pressure was defined at the top of the air boundary, and reverse flow was allowed. The heat sink was divided using quarter-symmetry, and the exterior air boundary side walls were set to a constant ambient temperature of 303.15 K. A heat flux of 11071 W/m2 (corresponding to the 25 W generated by the cartridge heaters) was applied at the base of the heat sink. This heat flux assumes that there is no heat lost between the heaters and the heat sink base. Additionally, a Boussinesq density approximation was used to reduce computation cost with a minimal reduction in accuracy. The difference in base temperature between the Fluent simulations and heat transfer correlations was 54.1 K and 41.7 K for the rectangular fin and pin fin heat sinks, respectively. These differences can be attributed to a wide array of simplifying assumptions in both the CFD simulations and heat transfer correlations. As part of these assumptions, radiation was neglected; however, radiation should not vary significantly with different model geometries. The air domain defined in the Ansys Fluent simulations is relatively small compared to open-air laboratory tests; however, testing showed that the base heat sink temperature was independent of the air domain size.
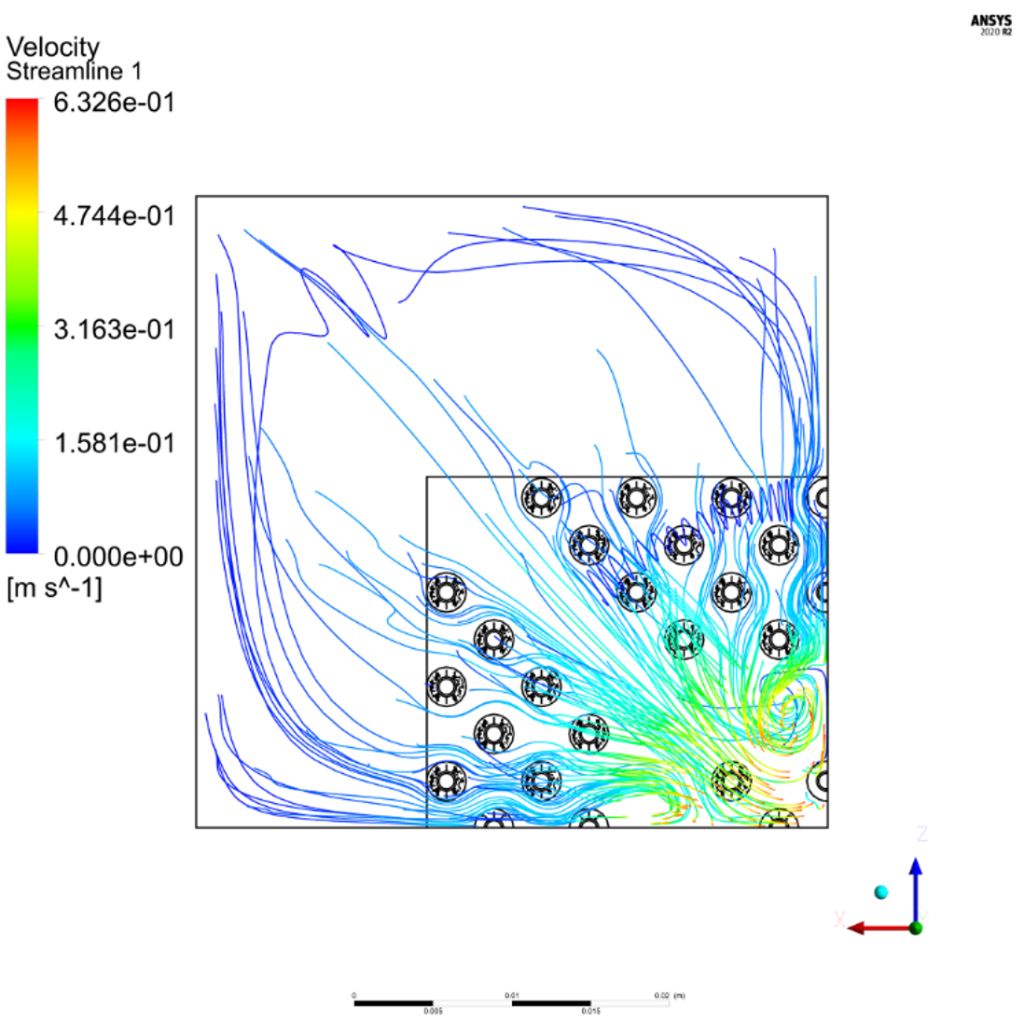
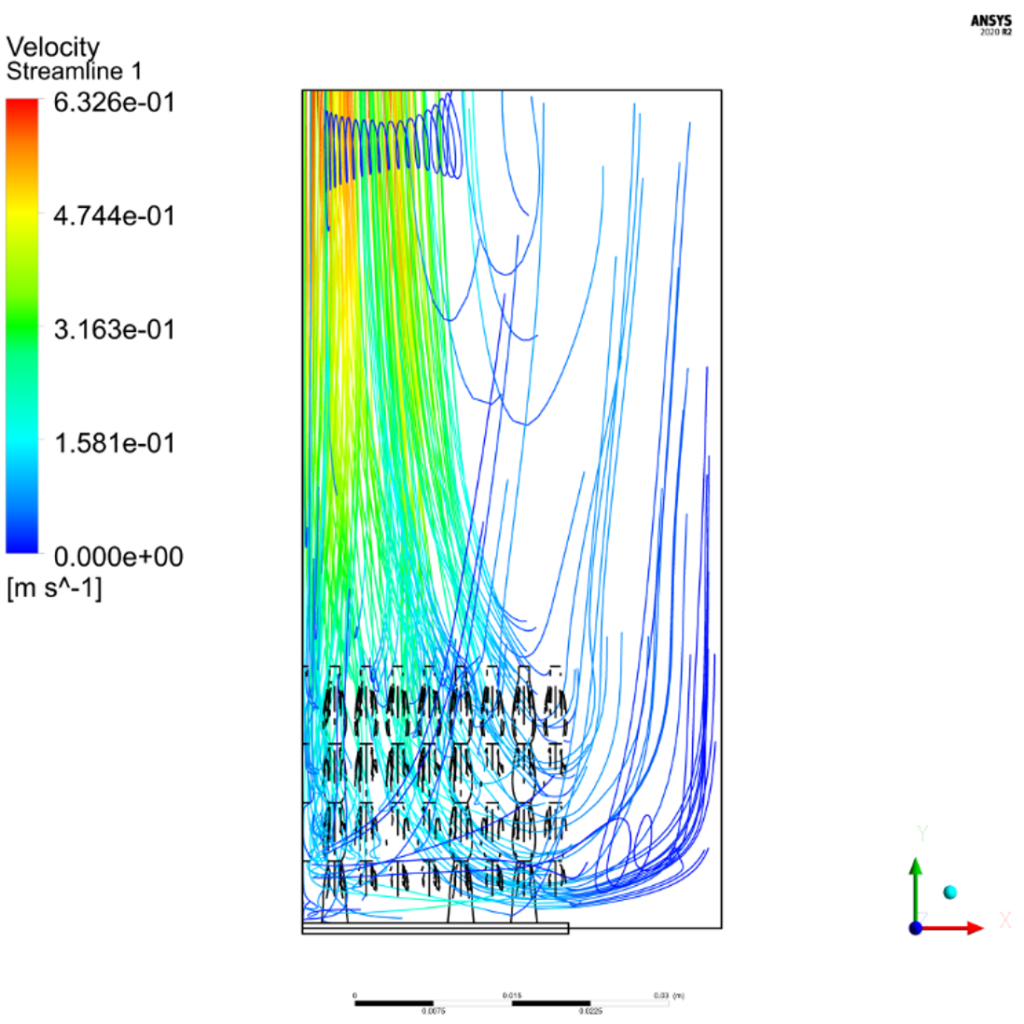
After the Ansys Fluent simulations of simple geometries had been verified, iterations of designs were tested to determine the final design geometry shown in Figures 12 and 13. This design had the largest FOM value of all designs tested and thus was chosen as the final design. For the final design, the fluid flow model was changed from a laminar to SST k−ω turbulence model which yielded negligible differences in base temperature. Figures 14 and 15 show the velocity streamlines for the turbulent model. In the center of the heat sink where the temperature is hottest, the air moves upward due to buoyant effects, while the cool air from the sides is drawn in along the lower portion of the heat sink due to the low-pressure region in the center of the heat sink. The velocity between the densely spaced pins is low, while the open channel supplies cooler air at a higher velocity to the center of the heat sink. The effect of this can be seen in the temperature distributions in Figures 14 and 15. The pins are coolest along the outer edges and are hotter in the center of the heat sink. The air temperature gradually rises as it flows inward between the densely distributed pins. The channel supplies cooler air directly to the center pins, making them more effective due to a larger temperature gradient between the surface of the heat sink and the surrounding air.

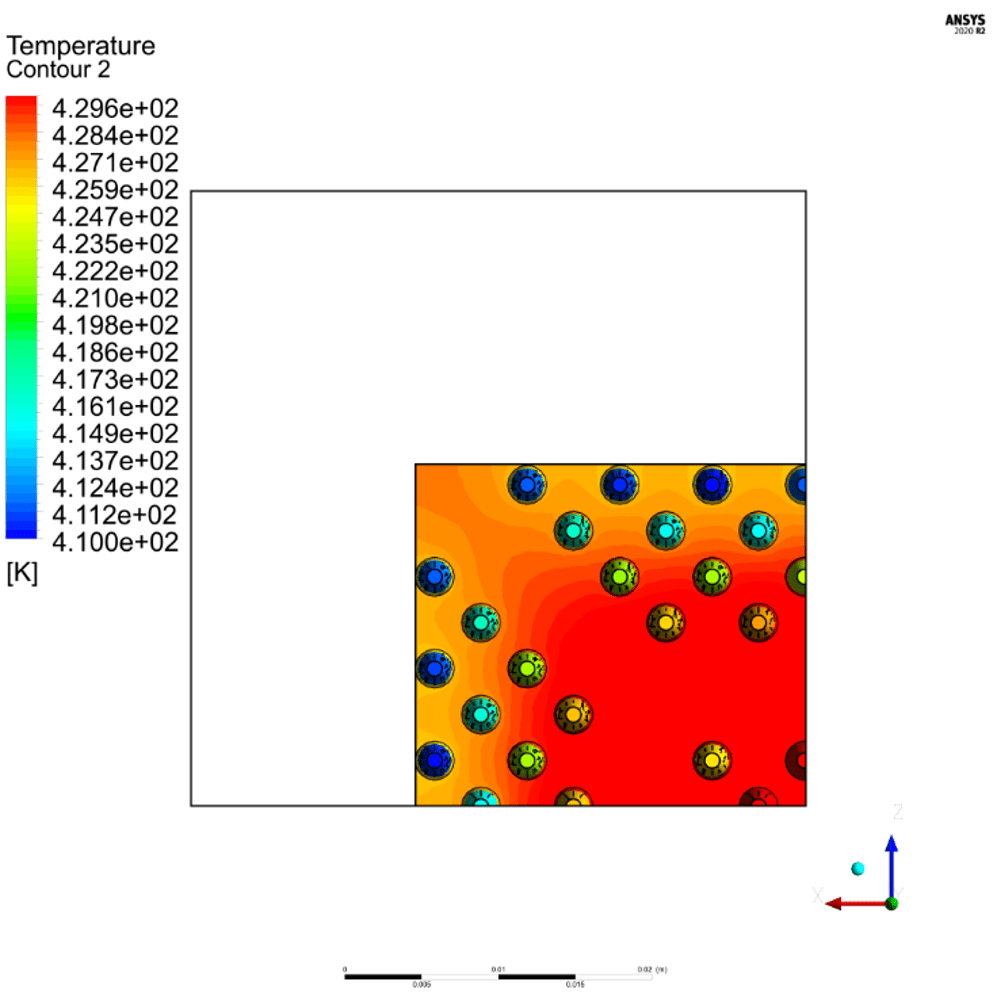
The base temperature of the heat sink was calculated in Ansys Fluent using the volume-averaged temperature of the heat sink base and was found to be 429.8 K. Using the FOM formula given in Equation 1, the FOM of the final heat sink geometry was calculated to be 0.002268 $-1⋅K-1.
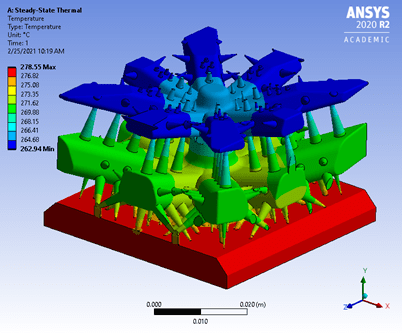
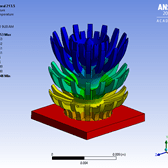
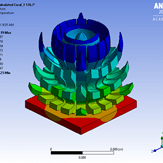
Given that our team was chosen as semifinalists for the competition, the design needed to be slightly modified to reduce the probability of failure during the AM process. We performed several finite element analysis (FEA) studies of the submitted heat sink to determine where the stresses were the highest. Given that the machine used to manufacture our design is unknown, the forces applied to the heat sink due to the recoater blade are unknown. Instead, we simply assumed a constant force of 2 N applied simultaneously across the tips of all pins. This gave insights into where stress concentrations might be during the build process and supports were placed accordingly. The FEA study of the final heat sink with supports is shown below which shows that the stress concentrations are consistent in value with one another.

Testing
The final heat sink design was successfully additively manufactured by General Electric (GE) and tested in Professor Gess’ lab at Oregon State University to quantify the “real world” FOM. This real world testing allowed the judges to get consistent results for all semi-finalist teams participating in the 2021 ITherm heat sink design competition. Teams were then judged based on the experimentally determined FOM. The results are shown below.

Our design was the clear winner, by a large margin. Not only is the temperature of the thermocouple in our heat sink 11% lower than the next lowest result, our FOM is nearly 12% better than the next closest competitor.
However, the competition was not over after this test, we still had to present to the judges the rationale behind our design and the methods we used to evaluate its performance. We chose team member and resident CFD wizard Bence Csontos to be the face of our team and make our case to the judges, and he did a phenomenal job. Due to our hard work and collaboration as a team we were able to win the competition.
